New
Analytics allows you to track
weekly online activity in your
module.
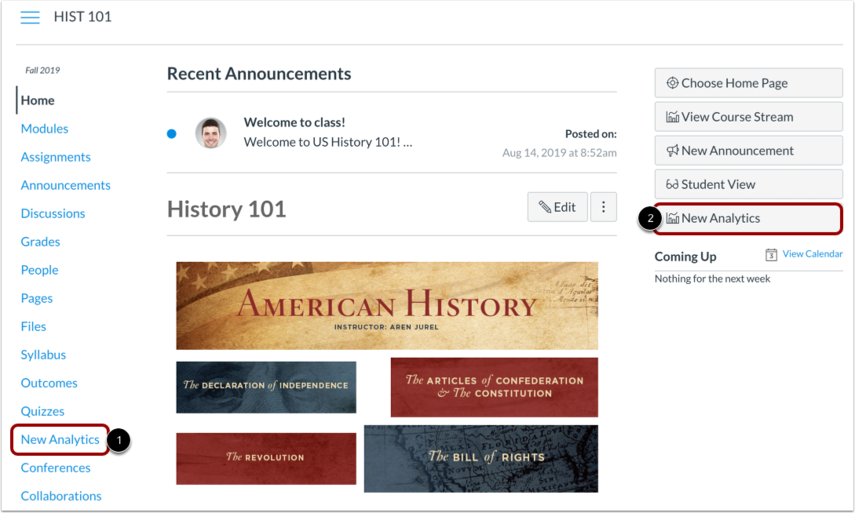
1. In Global Navigation, click Modules, then click the name of the
module.
2. To open New
Analytics:
- Click New
Analytics in the module
navigation [1] or
- Click New
Analytics in the module
home page [2].
3. If you cannot see the New
Analytics link, you may have to
make the link visible via the Navigation tab in Settings.
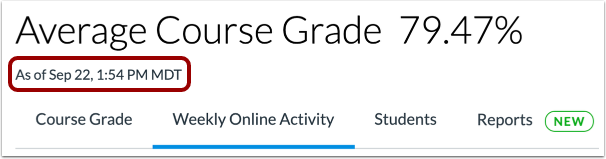
For reporting accuracy, the page displays
the last time analytics data was last
updated. Data is refreshed in New
Analytics every 24 hours.
4. Click Weekly Online
Activity.
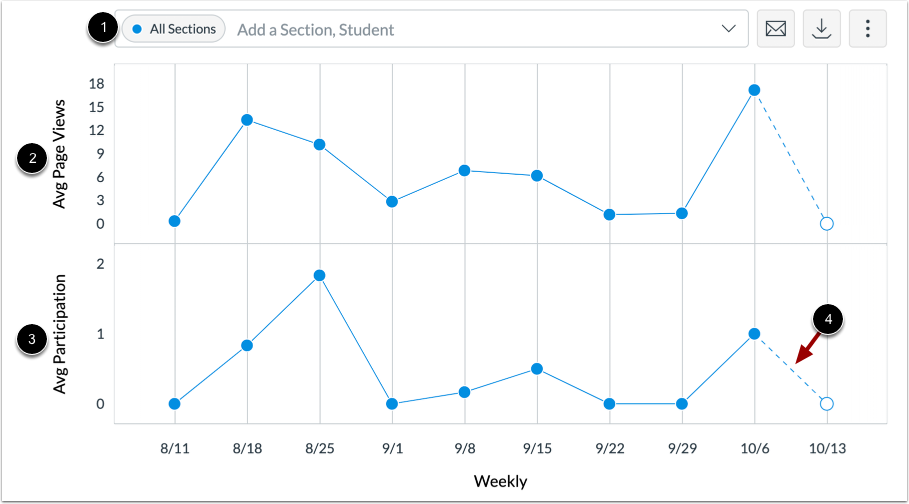
View Module Data
1. The
analytics page is dynamic
based on filtered content.
- By default,
all sections are
displayed and cannot
be removed
[1].
- Filtered data
is displayed as a
chart with two rows:
average page views [2]
and
- Average
participations [3].
The following actions will generate participations:
- Announcements: posts a new comment to an announcement
- Assignments: submits an assignment
- Collaborations: loads a collaboration to view/edit a document
- Discussions: posts a new comment to a discussion
- Pages: creates a page
- Quizzes: submits a quiz
- Quizzes: starts taking a quiz
- Data for the
week that is currently
in progress is
indicated by a dotted
line
[4].
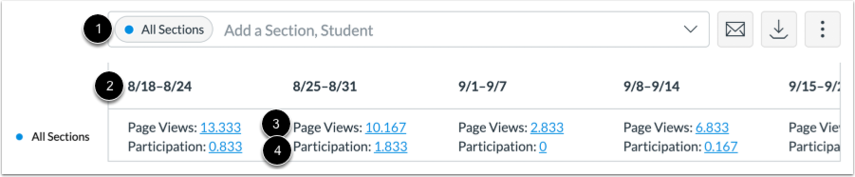
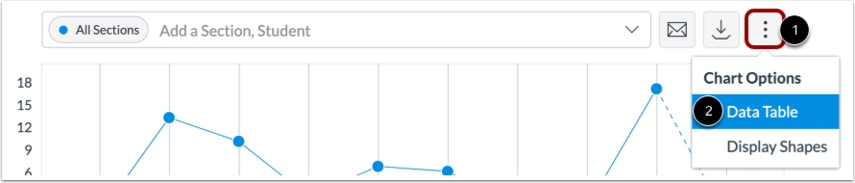
Data Table
1. If you want to see
weekly activity in a data table,
- Click
the options icon
[1] and
- Select Data
Table [2].
2. The
analytics page is dynamic
based on filtered content.
- By default,
all sections are
displayed and cannot
be removed
[1].
- Filtered data
is displayed as a
chart with a single
row for each filter,
including the date
range
[2]
- Average number
of page views [3], and
the average number of
participations
[4].