You can use filters to compare section, student, and assignment results with the course average.
1. In Global Navigation, click Modules, then click the name of the module.
2. To open New Analytics:
- Click New Analytics in the module navigation [1] or
- Click New Analytics in the module home page [2].
3. If you cannot see the New Analytics link, you may have to make the link visible via the Navigation tab in Settings. For reporting accuracy, the page displays the last time analytics data was last updated. Data is refreshed in New Analytics every 24 hours.
Filter Data
1. Click the filter field [1].
2. Type the name of a section, student, or assignment [2]. Canvas will populate all matching results.
3. When the item displays in the menu, click the item name [3].

View Additional Filters
1. To add another filter, locate the additional filter. The Filter field supports up to three filters.
Note: The All Sections filter cannot be removed.
Filter by Assignment
1. By default, analytics selects all assignment types to display within the page [1].
2. Each assignment in the chart displays the appropriate icon for each selected assignment type [2].
3. To view additional assignments within the filtered results, click and drag the scrollbar [3].

4. To filter by assignment type, clear the checkbox next to the assignment type. The chart dynamically updates the results based on the assignment type selected or removed in the filter.
Note: At least one assignment type is required at all times.View Section Comparison
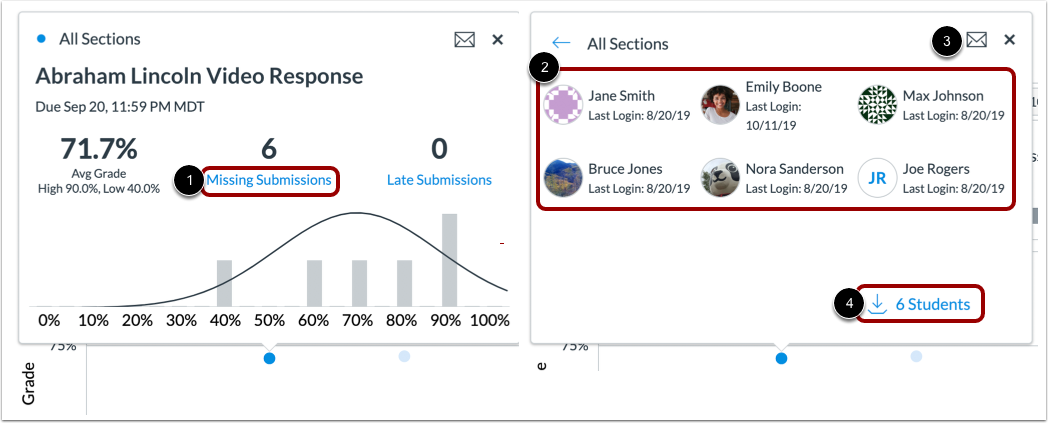
1. To view data for a section, click the data point for the section [1].
2. In a section comparison, details provide additional metrics for the section name, assignment name, assignment due date, average grade for the assignment, low and high grades by percentage, and number of missing and late submissions. You can hover over a percentage bar and view the number of students who achieved each grade percentage [2].
3.To send a message to all students in the section, click the Message icon [3].

4. When comparing sections, you can also view submissions by status: missing and late. To view the names of students within each status, click the link for the status [1].
5. The card displays the student information for the submission statuses, including the names and last login date for each student [2].
6. To message these students specifically, click the Message icon [3].
7. To export the submission status list as a CSV file, click the Download link [4].
View Student Comparison
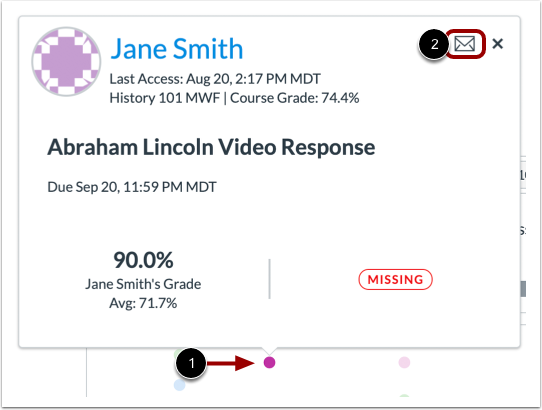
1. To view data for a student, click the data point for the student [1].
2. In a student comparison, details provide additional metrics for the student's full name, last access date, section, current course grade percentage, assignment name and due date, the student's grade for the assignment, the course average percentage, and the status of the assignment and submission date.
To send a message to the individual student, click the Message icon [2].
Note: You can also compare while viewing New Analytics in Data Table format.