New Analytics allows you to track
average grades for student submissions using
an interactive chart graph or data
table.
1. In Global Navigation, click Modules,
then click the name of the module.
2.
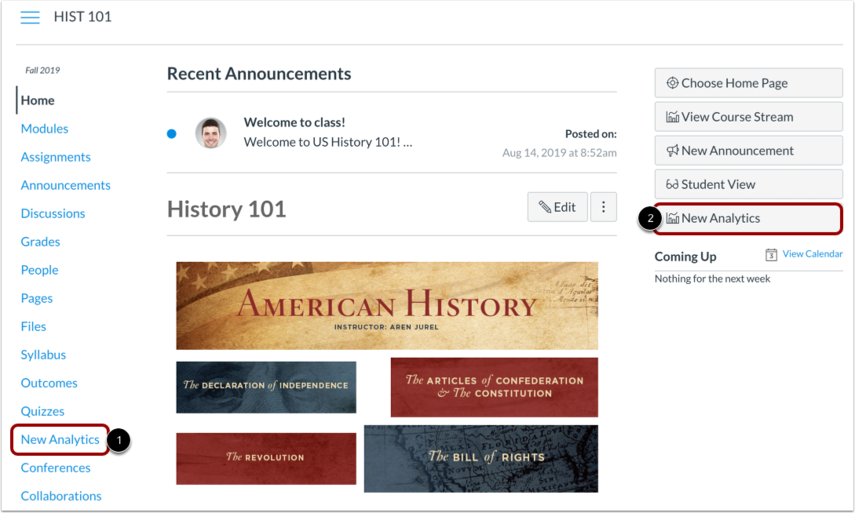
To open New Analytics,
- Click New
Analytics in the module navigation [1] or
- Click New
Analytics in the module home page
[2].
3. If you cannot see the New Analytics link, you may have to make the link visible
via the Navigation tab in Settings. For reporting accuracy, the
page displays the last time analytics data was
last updated. Data is refreshed in New
Analytics every 24 hours.
4. The
analytics page is dynamic
based on filtered content.
- By default,
all results display
the course average,
which cannot be
removed
[1].
- You can also
view the average grade
percentage for all
students [2], which is
not affected by any
filter.

Filter by Assignment
1. By default, analytics selects all
assignment types to display within the page
[1].
2. Each assignment in the chart
displays the appropriate icon for each visible
assignment type [2].
3. To view additional assignments,
click and drag the scrollbar [3].

4.
To filter by
assignment
type, clear
the checkbox
next to the
assignment
type. The
chart
dynamically
updates the
results based
on the
assignment
type selected
or removed in
the
filter.
Note: At
least one assignment type is
required at all
times.
5. For analytical comparisons, you
can compare graph
data by filtering a section,
student, or
assignment.
Data table

1. Click
the options icon
[1] and select Data
Table [2].